There will be a short math test on Thursday to bring our Data Management and Probability unit to a conclusion. So far, we have used data to create pictographs and bar graphs. We have developed survey questions, conducted surveys and organized our results in bar graphs. We have interpreted graphs and described them using comparative statements and we have focused on using scales greater than one to represent data. We've also explored mode (grade 3) and median (grade 4) using human graphs. We've created simple games which involve probability. We acted as "toy testers" and determined the fairness and effectiveness of games created by our classmates.
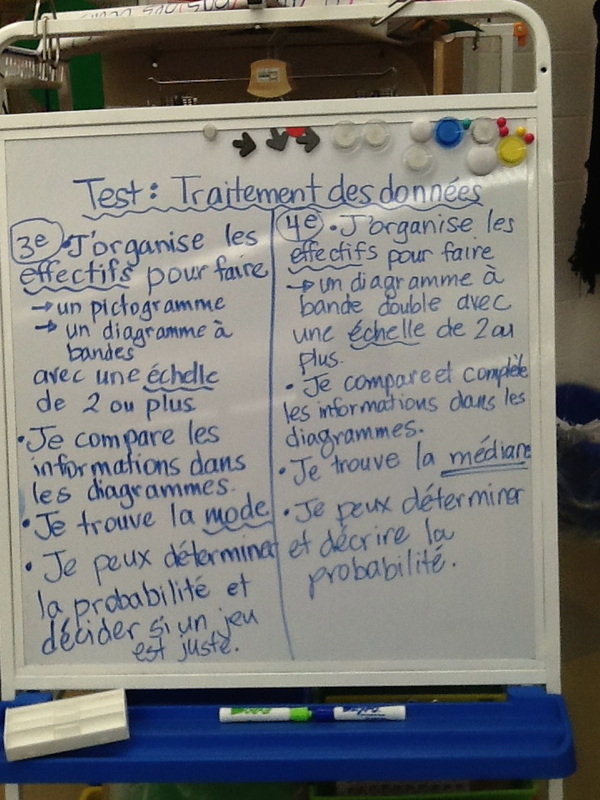
This week's test will let us do some problem solving, applying our knowledge. The photo below is the note that we put into our notebooks on Monday. In order to practice these concepts, students are encouraged to try activities from Chapter 3 of Nelson Math (go to my math page and use the Nelson Math button for your grade). Another great place to go is MathFrog. The activities in Grade 4 provide excellent refreshers and additional practice for these concepts. Click on the button to go directly to Math Frog's Data Management and Probability activities page.
This week's test will let us do some problem solving, applying our knowledge. The photo below is the note that we put into our notebooks on Monday. In order to practice these concepts, students are encouraged to try activities from Chapter 3 of Nelson Math (go to my math page and use the Nelson Math button for your grade). Another great place to go is MathFrog. The activities in Grade 4 provide excellent refreshers and additional practice for these concepts. Click on the button to go directly to Math Frog's Data Management and Probability activities page.
 RSS Feed
